

This is a guest post by our intern, George Lewkowicz (closet statistician)
We want to make everyone better runners. With Zombies, Run!, we realised that we are collecting hundreds of thousands of runs with speed and music data. There have been several scientific studies trying to find the best music to improve a runner’s speed by analysing a track’s speed in bpm (beats per minute).
When I saw the huge amount of run data we have, the inner statistician in me came out, and I realised we can finally settle this debate once and for all! Using simple multi-variate analysis we sought to identify any common relationships within the data and, ultimately, find the top thirty tracks that seem to improve a runner’s speed when playing Zombies, Run!
The headline news is that 140bpm IS statistically significant (as found by some other studies). In other words, running to songs with 140 beats per minute will make you run faster. Here’s the relationship:
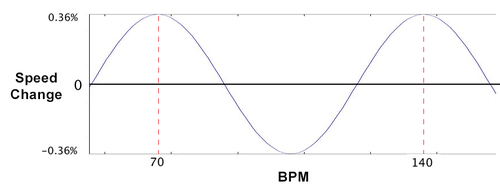
Other studies have suggested that this is linked to your running gait, because 140bpm is roughly the same pace that the average person runs at. The reason for the other peak at 70bpm is that it’s half of 140bpm, so you get a beat with every other step you take.
Now, before you get excited, a 140bpm playlist will not suddenly turn you into a brilliant runner – it only speeds you up by about 0.36%. Compared to the 2.1% speed-up we’ve found when players are running during their first song – and the 3.4% slow-down during their last song, it’s not a huge amount.
But we did find a secret that could improve your run: some specific tracks in our database seem to hugely improve running speed. We think it’s all about being uplifted by the track; some songs just have that oomph that drive you forward. So without further ado, here’s are the statistically-evidenced songs that will make you run faster!
(Of course, your mileage may vary…!)
Want to know all the details? Read on…
Assumptions
- Zombies, Run! users are a representative sample of the population of all runners.
- Our BPM values for each track are correct, and stay constant (this is almost certainly not true).
Home grown data:
- Anonymous run logs from all users.
- Looking at speed during a track.
- The speed was first been normalised to the run (so we’re looking at percentage increases in speed during a run)
Other data:
BPM for each track. There is NO good place to get this data from the web. The majority of our track data came from http://www.cs.ubc.ca/~davet/music/bpm as this allows us to retrieve it in the most downloadable form, however we also used www.djbpmstudio.com and www.bpmdatabase.com.
Even so we couldn’t find the bpm for the majority of our track data, particularly newer songs. We only used the data for which we had bpm (though this requirement was removed for the calculation of the top 30 tracks). It was then filtered further removing tracks where a user was running either a third faster or slower than their average rate for the runs as to remove people using interval training. Tracks where a zombie chase was initiated were also filtered.
This still meant we had 86,000 rows of data, so there was no need to panic.
Multi-variate analysis was used trying several relationships to bpm. This means we allowed for other reasons as to why a run could be faster, for example the position of the track in the run, and removed the effects when looking at the bpm relationship that we were interested in.

We tried several non-linear relationships to bpm. A linear relationship would mean that the speed would increase as the bpm increased so that you could draw a straight line through the data. As we thought there would be a peak bpm, we needed a non-linear relationship.
The most significant bpm relationship was a sine curve with peaks at 70bpm and 140bpm. Some trial and error was used to see the effect of sine curves with different peaks, however the most significant was 140bpm to the nearest integer at a significance level of 0.2%.
The tracks are listed by the significance of the z-value from the general population of all tracks with the count of n being the number of users that had played the track, and the average increase per user per track used. This means that the tracks are listed by the probability that they make you faster, rather than the amount that they increase your speed.
The t-statistic (a different measurement of probability used for smaller datasets) was considered, but it was felt that we had a large enough dataset that the difference between the two probabilities would be small, and that as we are looking for an ordering rather than a significance it was also irrelevant. All 30 tracks improve running time past a 5% significance level.
While every effort was made to be as statistically rigorous as possible, there are some obvious flaws in our assumptions. The comment section should not be a place to troll our statistics. The songs however should be attacked at will…
